Air quality and temp @ home
- Date: Jan 2018
- Idea/Intention: Create a dashboard for my home. Capture data on air quality, air temperature, and plant metrics. Learn about trends over time.
- Sourced Data from: Wio sensors.
- Technology stack:
- Challenges:
- Getting the Grafana and Influx stack up. But once the docker images were up its been smooth sailing for the most part.
- Outcome:
- Charts which I can easlity switch the time scale on.
- End of last year I deployed some remote sensors in India and had them report back to here.
- Next steps:
- Fix the plant sensors.
- Add more.
- The Viz:
Air temp and quality for 1 week vs 1 year
One Week
One Year
- Anyone: What's a good and bad reading? Ideally what should this look like?
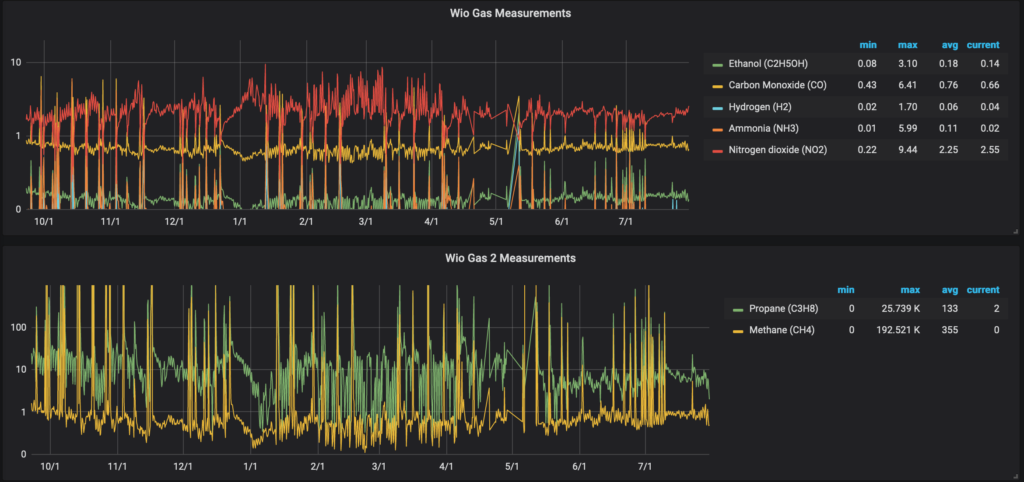
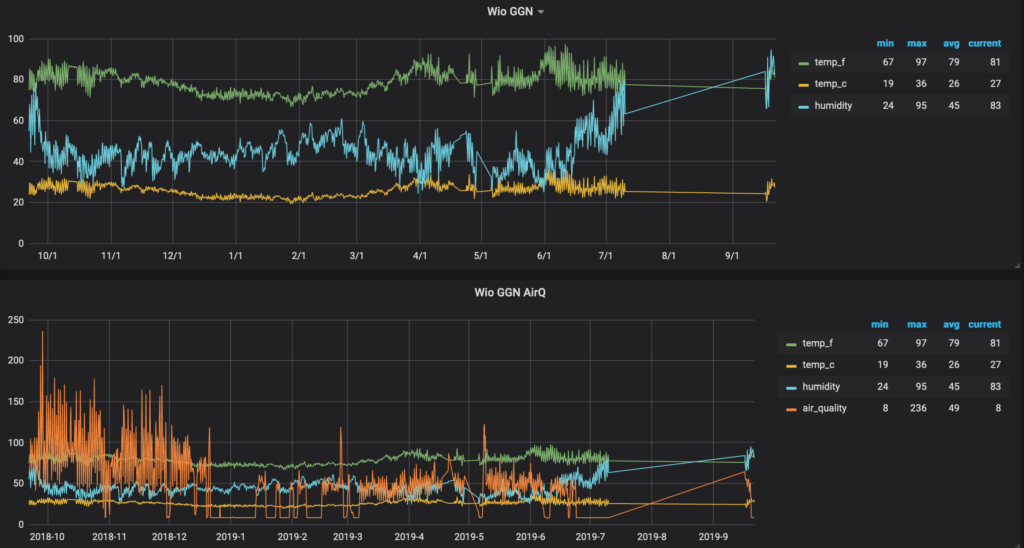
Gas readings for a year
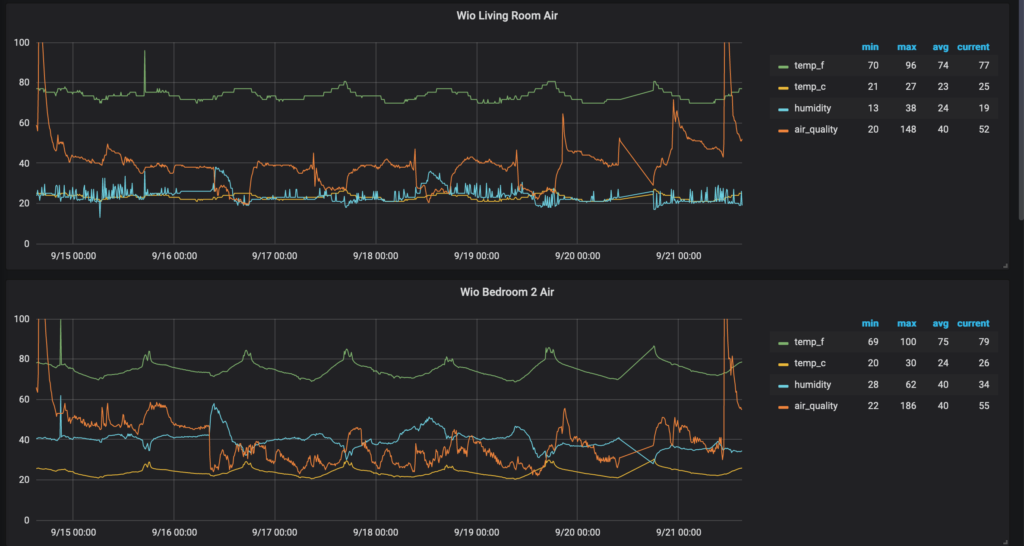
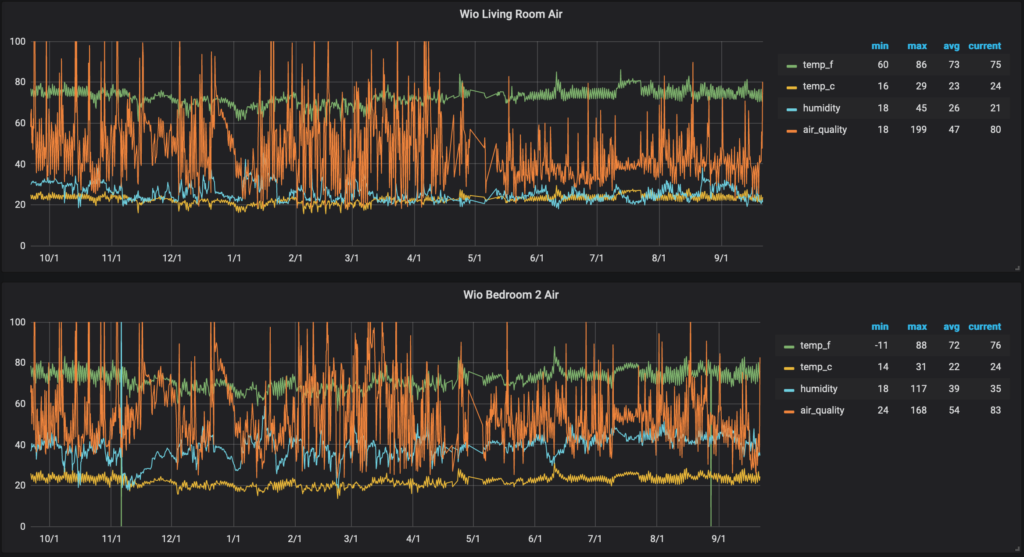
Air temp and quality for 1 week vs 1 year (The मेरा गाँव Edition)
One Week - The sensors were turned back on after a vacation

One Year - You see the gap is cause the sensors were off during vacation
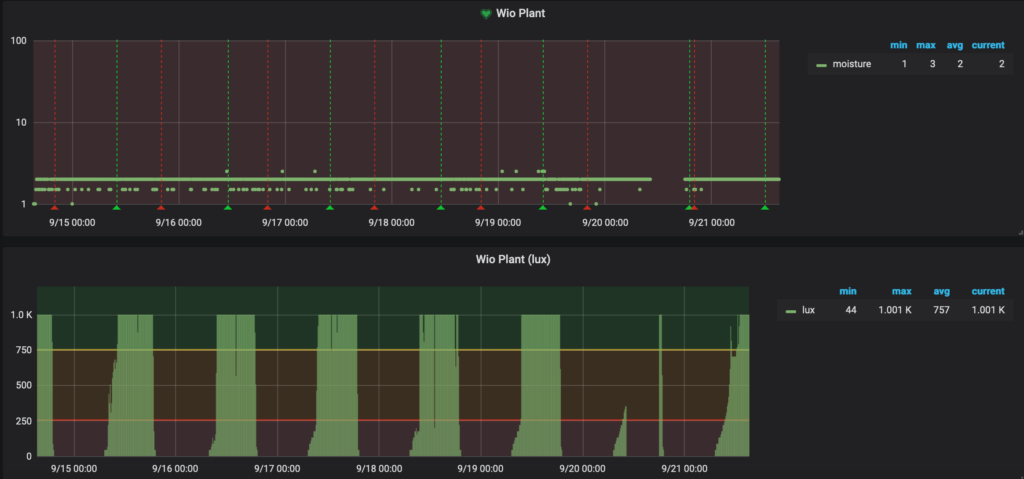
My plant talks, but I don't listen
- The first chart is moisture and the second is light.
- I think the moisture sensor is broken, or my plant is dying of thirst. I just watered it out now out of guilt.